With the observance of Martin Luther King, Jr. Day on Monday, it’s worth reviewing the racial progress each state has made across various data sets.
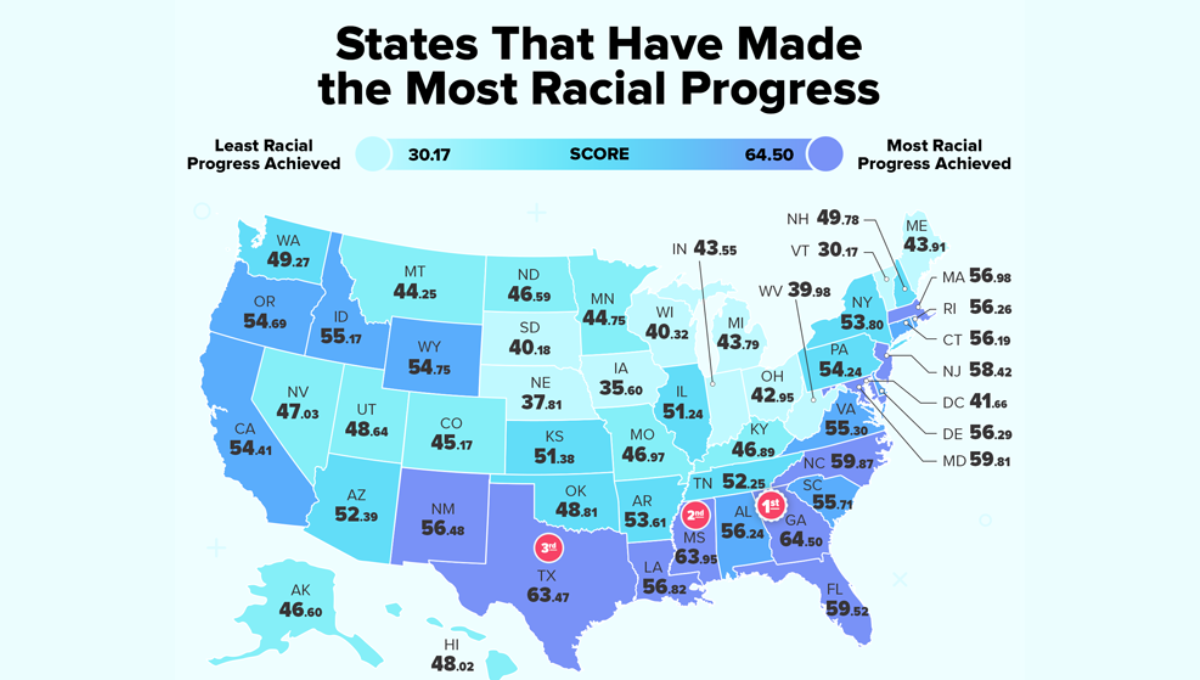
Personal-finance company WalletHub recently released its report on the States That Have Made the Most Racial Progress, along with expert commentary, to highlight where we’ve made the biggest strides toward equality over the past several decades.
WalletHub measured the gaps between black people and white people across 22 key indicators of equality in each of the 50 states and the District of Columbia. The data set ranges from median annual household income to standardized-test scores to voter turnout.
Racial Integration in Georgia (1=Most Integrated, 25=Avg.):
Source: WalletHub
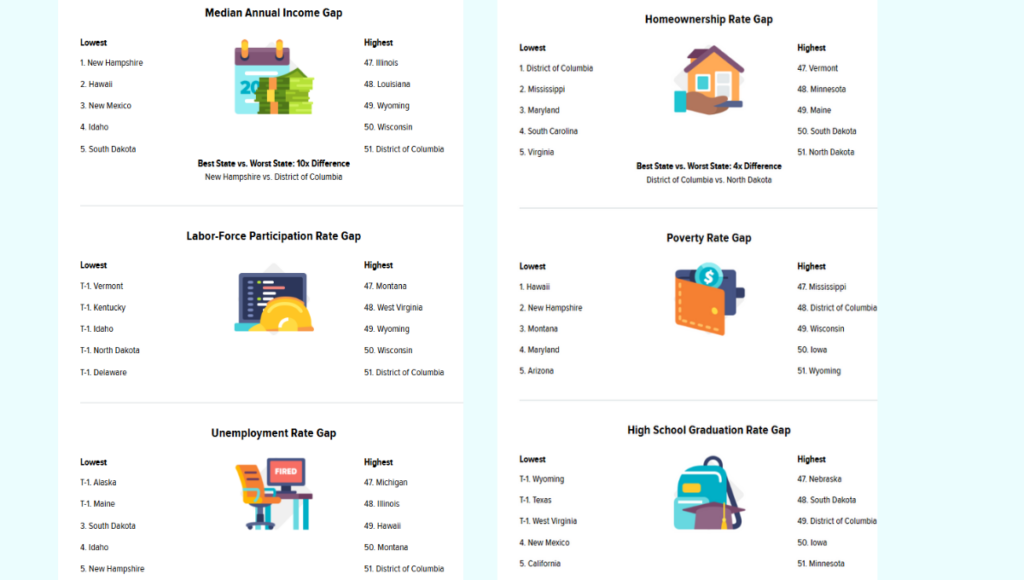
Note: All of the following comparisons refer to the gaps between white people and black people, according to the most recent available data:
States with the Most Racial Integration
| Overall Rank* | State | Total Score | Employment & Wealth Rank | Education Rank | Social & Civic Engagement Rank | Health Rank |
|---|---|---|---|---|---|---|
| 1 | Arizona | 72.76 | 7 | 8 | 1 | 5 |
| 2 | New Mexico | 71.31 | 9 | 2 | 3 | 15 |
| 3 | Delaware | 71.18 | 2 | 16 | 6 | 10 |
| 4 | Washington | 71.11 | 8 | 18 | 14 | 1 |
| 5 | Texas | 69.39 | 14 | 7 | 8 | 12 |
| 6 | Maryland | 68.97 | 6 | 24 | 10 | 9 |
| 7 | Hawaii | 68.83 | 3 | 5 | 17 | 28 |
| 8 | Georgia | 68.62 | 10 | 11 | 4 | 24 |
| 9 | Kentucky | 68.49 | 11 | 10 | 21 | 8 |
| 10 | Alaska | 67.08 | 1 | 14 | 12 | 45 |
| 11 | North Carolina | 66.55 | 17 | 19 | 7 | 20 |
| 12 | West Virginia | 66.23 | 23 | 3 | 24 | 18 |
| 13 | Virginia | 66.21 | 13 | 25 | 9 | 27 |
| 14 | Colorado | 64.90 | 24 | 20 | 18 | 11 |
| 15 | Tennessee | 64.65 | 15 | 4 | 29 | 39 |
| 16 | Oklahoma | 64.15 | 31 | 6 | 11 | 35 |
| 17 | California | 64.06 | 28 | 29 | 5 | 23 |
| 18 | Florida | 63.43 | 12 | 34 | 33 | 17 |
| 19 | Oregon | 62.80 | 18 | 12 | 43 | 7 |
| 20 | Massachusetts | 62.39 | 26 | 40 | 36 | 4 |
| 21 | Rhode Island | 62.19 | 16 | 48 | 37 | 2 |
| 22 | Kansas | 62.00 | 38 | 23 | 15 | 14 |
| 23 | New Jersey | 61.75 | 30 | 27 | 13 | 31 |
| 24 | Alabama | 61.52 | 27 | 15 | 20 | 43 |
| 25 | Nevada | 60.94 | 22 | 35 | 25 | 25 |
| 26 | Indiana | 60.19 | 37 | 26 | 23 | 21 |
| 27 | South Carolina | 59.91 | 19 | 36 | 16 | 47 |
| 28 | Utah | 59.82 | 32 | 33 | 2 | 49 |
| 29 | Missouri | 59.74 | 25 | 30 | 34 | 37 |
| 30 | New Hampshire | 59.66 | 5 | 28 | 48 | 46 |
| 31 | Vermont | 59.07 | 39 | 9 | 40 | 3 |
| 32 | New York | 59.05 | 36 | 43 | 27 | 13 |
| 33 | Idaho | 58.97 | 4 | 44 | 47 | 32 |
| 34 | Mississippi | 58.90 | 35 | 21 | 35 | 33 |
| 35 | Pennsylvania | 58.14 | 41 | 22 | 30 | 26 |
| 36 | Connecticut | 57.80 | 20 | 42 | 41 | 22 |
| 37 | Arkansas | 57.20 | 34 | 13 | 44 | 40 |
| 38 | Ohio | 56.39 | 43 | 39 | 19 | 36 |
| 39 | Louisiana | 56.27 | 40 | 37 | 31 | 34 |
| 40 | Maine | 56.00 | 21 | 38 | 46 | 38 |
| 41 | Wyoming | 55.00 | 49 | 1 | 28 | 42 |
| 42 | Illinois | 53.29 | 47 | 32 | 26 | 41 |
| 43 | North Dakota | 52.13 | 33 | 31 | 49 | 29 |
| 44 | Montana | 51.80 | 42 | 17 | 32 | 51 |
| 45 | Nebraska | 51.78 | 44 | 50 | 22 | 19 |
| 46 | Iowa | 51.55 | 48 | 46 | 42 | 6 |
| 47 | Michigan | 51.01 | 45 | 41 | 38 | 48 |
| 48 | Minnesota | 50.61 | 46 | 47 | 45 | 16 |
| 49 | South Dakota | 50.00 | 29 | 45 | 50 | 30 |
| 50 | Wisconsin | 36.76 | 50 | 49 | 51 | 44 |
| 51 | District of Columbia | 30.90 | 51 | 51 | 39 | 50 |
Notes: *No. 1 = Most Integrated
With the exception of “Total Score,” the columns in the table above depict the relative rank of each state, where a rank of 1 represents the best conditions for that category.
Overall rank for Georgia: 8th
- 20th – Median Annual Household Income Gap
- 13th – Labor-Force Participation Rate Gap
- 25th – Unemployment Rate Gap
- 6th – Homeownership Rate Gap
- 16th – Poverty Rate Gap
- 13th – High School Graduation Rate Gap
- 18th – Bachelor’s Degree Attainment Gap
- 22nd – Standardized-Test Scores Gap
- 15th – Voter-Turnout Gap (2024 Presidential Election)
In-Depth Look at the States With the Most Racial Progress
Georgia
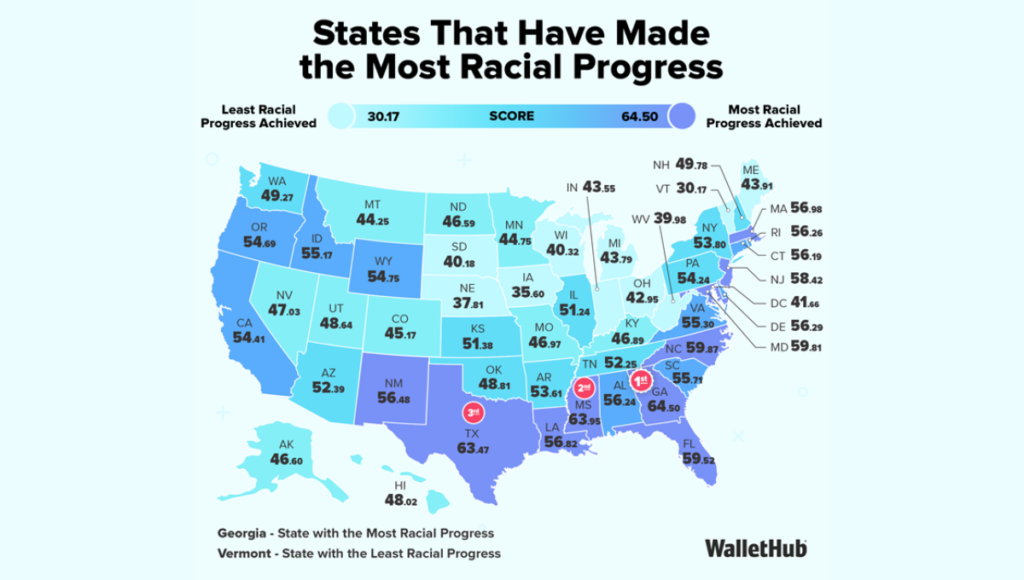
Georgia has made the most racial progress. For one thing, it has reduced the gap between the earnings of white and Black Americans by over 32 percentage points since 1979, the largest reduction in the nation.
Georgia has also made great strides when it comes to education, cutting the disparity between the share of white and Black residents who have at least a high school degree by more than 23 percentage points since 1970. Making educational attainment more equitable is likely one of the major reasons why there has been so much progress when it comes to salaries, as higher education correlates with higher earnings.
On top of that, Georgia ranks first for progress when it comes to business ownership rate, and fourth-best for improving the number of Black residents in executive positions.