


The cost of health insurance continues to eat away at household budgets across the country, but a new analysis shows the financial burden varies dramatically depending on where Americans live.
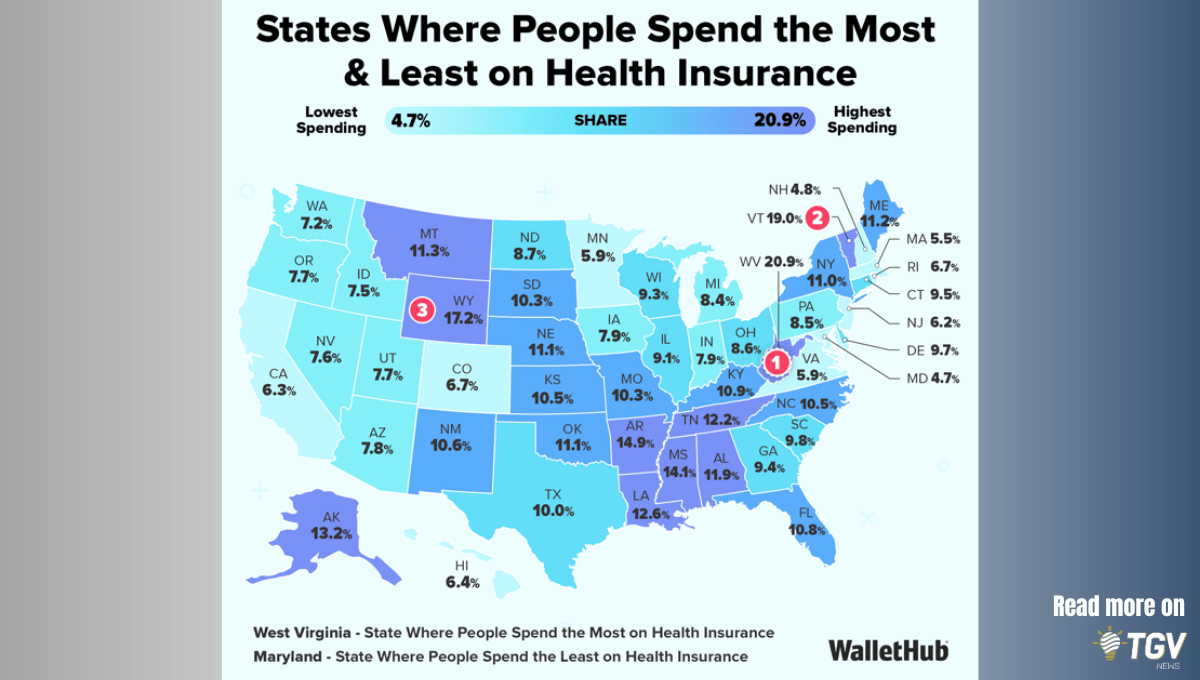
In this week’s Map Monday, we rely on WalletHub’s recent analysis of where residents spend the largest portions of their household income on health insurance premiums. Georgia landed almost exactly in the middle of the country, ranking 26th among the 50 states for the highest health insurance spending burden.
According to the analysis, the average cost of health insurance in Georgia amounts to 9.37% of the state’s median monthly household income.
That means, at least by WalletHub’s measurement, nearly one out of every $10 in median household income would be needed to cover the average premium for the type of health insurance plan examined in the study.
Measuring the Cost of Health Insurance Against Income
Like most things, health insurance premiums have increased in recent years. WalletHub cited data showing premiums rose 5% for individual plans and 6% for family plans in 2025 alone.
The personal finance company said the burden is particularly uneven across state lines. In the most expensive state, health insurance premiums consume nearly 21% of median household income. In the least expensive state, the figure is below 5%.
WalletHub also measured affordability by looking at premiums as a percentage of income. The analysis examined the average premium for a silver-level health insurance plan in each of the 50 states. Silver plans are generally designed to offer a middle ground between monthly premiums and deductibles.
States Where People Spend the Most & Least on Health Insurance
| Overall Rank* | State | Cost of Insurance as % of Median Monthly Household Income |
|---|---|---|
| 1 | West Virginia | 20.86% |
| 2 | Vermont | 19.05% |
| 3 | Wyoming | 17.16% |
| 4 | Arkansas | 14.87% |
| 5 | Mississippi | 14.05% |
| 6 | Alaska | 13.18% |
| 7 | Louisiana | 12.58% |
| 8 | Tennessee | 12.19% |
| 9 | Alabama | 11.85% |
| 10 | Montana | 11.27% |
| 11 | Maine | 11.18% |
| 12 | Nebraska | 11.14% |
| 13 | Oklahoma | 11.11% |
| 14 | New York | 11.00% |
| 15 | Kentucky | 10.87% |
| 16 | Florida | 10.85% |
| 17 | New Mexico | 10.58% |
| 18 | Kansas | 10.50% |
| 19 | North Carolina | 10.49% |
| 20 | South Dakota | 10.26% |
| 21 | Missouri | 10.25% |
| 22 | Texas | 9.95% |
| 23 | South Carolina | 9.76% |
| 24 | Delaware | 9.68% |
| 25 | Connecticut | 9.48% |
| 26 | Georgia | 9.37% |
| 27 | Wisconsin | 9.32% |
| 28 | Illinois | 9.14% |
| 29 | North Dakota | 8.66% |
| 30 | Ohio | 8.62% |
| 31 | Pennsylvania | 8.54% |
| 32 | Michigan | 8.45% |
| 33 | Iowa | 7.95% |
| 34 | Indiana | 7.89% |
| 35 | Arizona | 7.79% |
| 36 | Utah | 7.74% |
| 37 | Oregon | 7.73% |
| 38 | Nevada | 7.59% |
| 39 | Idaho | 7.47% |
| 40 | Washington | 7.21% |
| 41 | Colorado | 6.72% |
| 42 | Rhode Island | 6.67% |
| 43 | Hawaii | 6.37% |
| 44 | California | 6.32% |
| 45 | New Jersey | 6.23% |
| 46 | Minnesota | 5.89% |
| 47 | Virginia | 5.86% |
| 48 | Massachusetts | 5.49% |
| 49 | New Hampshire | 4.77% |
| 50 | Maryland | 4.66% |
Note: *No. 1 = Highest Spending


